Basic methods of data analysis
1. Clarify the problem
For data analysis, the most important thing is not the data analysis itself, but the problem.
That is, what do you want to know?
The ability to ask questions is more important than the ability to solve them.
I deeply agree with this statement.
This statement is especially true when it comes to data analysis.
Different people will ask different questions from different directions and angles about the same thing. Clear, unambiguous and specific questions will make the data analysis itself simple and effective.
A big reason why a lot of data analysis is difficult is that the questions are unclear and unspecific.
2. Analysis Problem

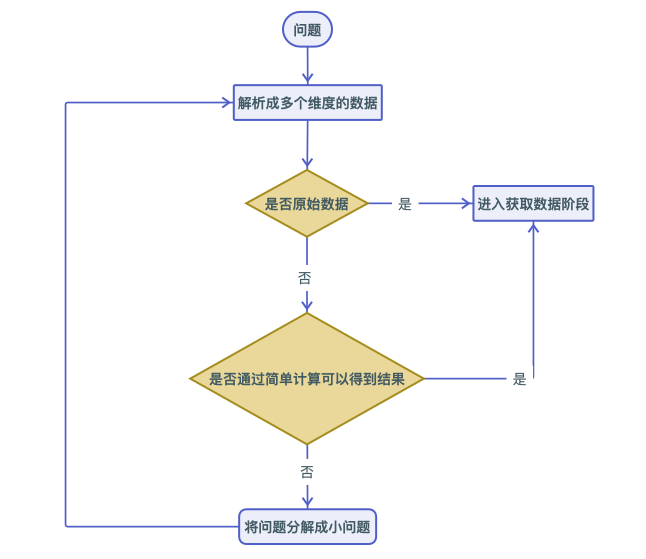
What dimensions of data do the answers to the questions come from?
Is the original data available for all of this data?
If all the original data can be obtained, then the point burying stage can be entered.
If the original data cannot be obtained for some data, you can judge whether the results can be obtained through simple calculations. If it is possible, then you can enter the stage of burying points to obtain data. If simple calculations do not yield results, then the problem needs to be broken down into smaller, simpler problems.
In short, there are two key points in analyzing the problem. One is that the data of those dimensions determine the answer to the question, and the other is to obtain as much original data as possible.
The reason why we need to obtain the original data as much as possible is that, based on my previous experience in a large amount of data analysis, too many and too complex calculations will easily lead to the final results deviating from the actual situation, that is, the probability of distortion will be greater and the degree of distortion will also be greater.
Of course, this is not absolute. If the algorithm is rigorous enough, you can also consider methods of obtaining results through complex calculations.
3. Obtain data
1. Bury point
Tracking is a very skillful thing, but it is also a very easy thing to get confused. It is best to have a unified tracking planning and management.
2. Crawling data
Say no more.
3. User survey
Say no more.
4. Data visualization and comparison
The results of data analysis must be visualized. Only in this way can problems be seen and answers can be obtained.
One thing we often encounter when visualizing data is what kind of chart should we use?
A data table can use a bar chart, a line chart, or even a pie chart, etc. At this time, how to choose?
Compared.
This is the criteria for selecting charts.
Data visualization is primarily for comparison. Only through comparison can we discover problems and find answers.
There are two types of comparison. One is the comparison of data in the same chart. For example, in a histogram, you can clearly see the amount/size of data in a certain dimension.
The other is the comparison of multiple charts, which can reveal many things.
So, which chart to use for visualization depends on what data you want to compare and how.

关注我的微信公众号

